Video Calling KPI Dashboard
Source: Interactive Powers. Creative Commons
Introducing New KPI Dashboard: Best Performance Tracking
We are excited to announce the latest update to our Web ACD 1.21 platform, which introduces a cutting-edge KPI Dashboard. This significant enhancement represents a major leap forward in our system’s capabilities and promises to improve the user experience for our clients.
The newly implemented KPI Dashboard offers a comprehensive and intuitive view of critical productivity metrics, meticulously designed to cater to the needs of both Supervisors and Agents. By presenting a wealth of fresh insights into performance data, this powerful tool empowers users to make more informed decisions and dramatically improve operational efficiency. The dashboard’s user-friendly interface showcases key performance indicators in a clear, visually appealing format, enabling users to gain deeper insights into their operations and pinpoint specific areas that may benefit from targeted improvements.
With this new feature, users can effortlessly monitor real-time performance metrics (KPI), track historical trends, and make data-driven decisions to optimize their workflow. The KPI Dashboard not only streamlines the process of performance evaluation but also fosters a culture of continuous improvement within organizations. By providing instant access to crucial metrics, it enables teams to respond swiftly to changing conditions and maintain peak performance levels consistently.
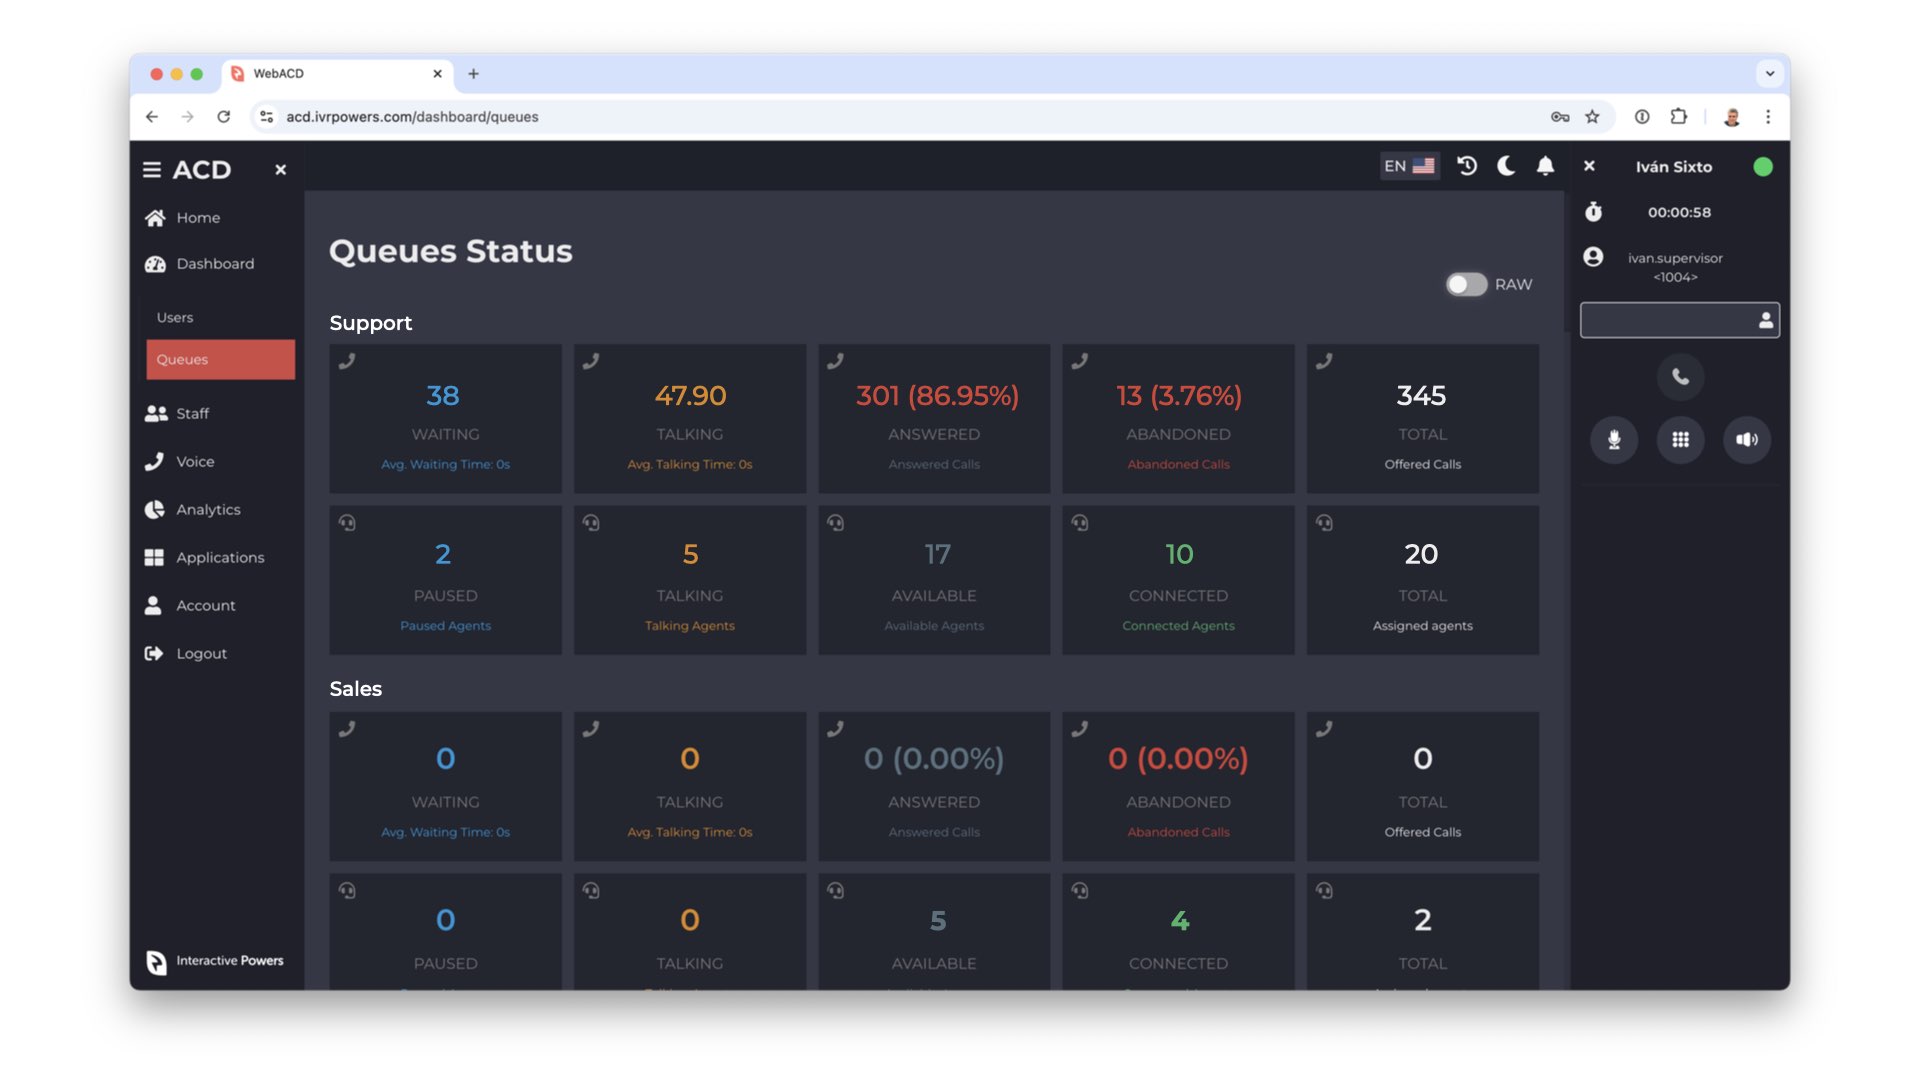
RAW Dashboard (Previous Mode)

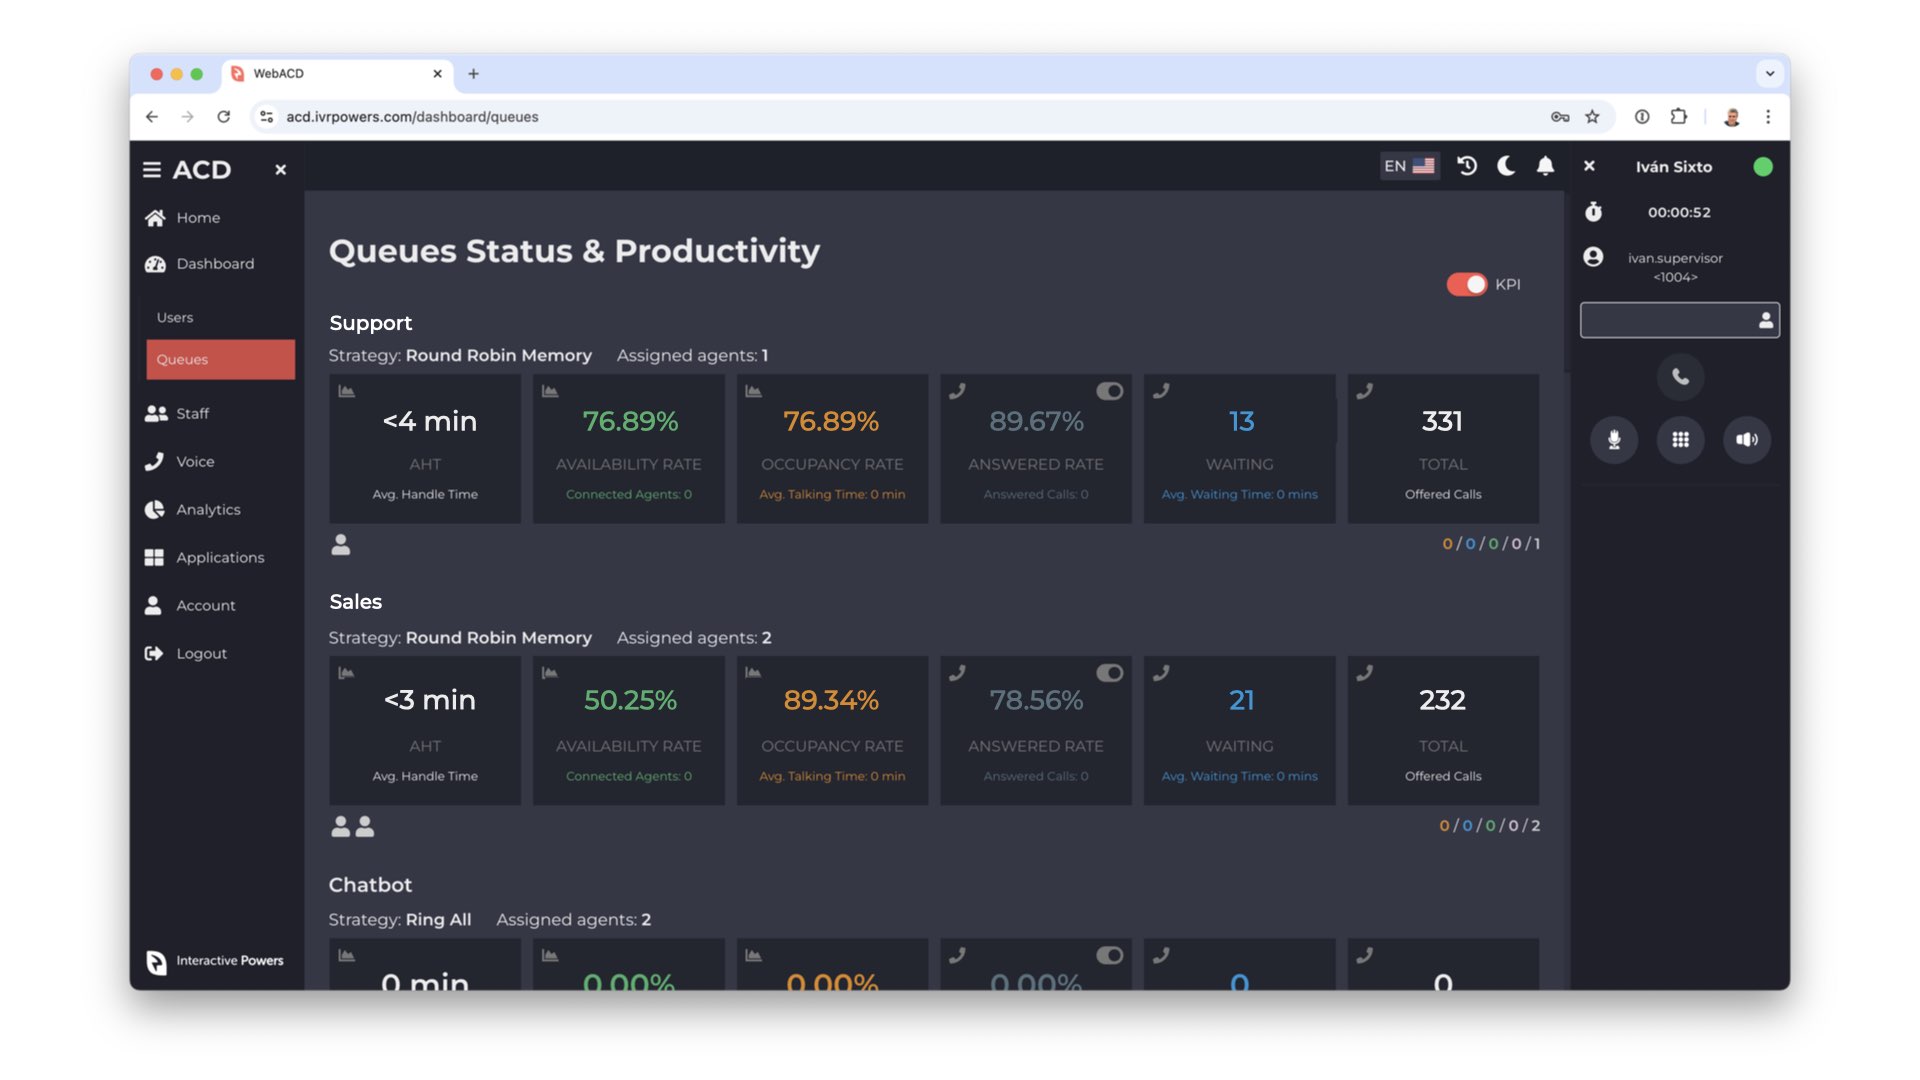
KPI Dashboard (Updated Mode)

Real-time Rate / Settings Indicators:
- AHT (Average Handle Time)
- Stats / Calling Rates
- Queue Strategy
- Agents Status Graph
Interactive Powers - Streamline your business communications
